> ## Documentation Index
> Fetch the complete documentation index at: https://docs.allyy.io/llms.txt
> Use this file to discover all available pages before exploring further.

# Dashboards evaluation

# Model Evaluation Dashboards

The Model Evaluation section provides a set of dashboards that allow users to assess how a model performs across different business objectives. Each dashboard focuses on a specific prediction type and business case, helping users understand model quality, behavior, and impact.

## Prediction Types and Business Cases

The platform supports two main prediction types, each with its own set of business cases.

### Classification (Propensity / Probability)

These models predict the likelihood of a specific user action or outcome. They are used to prioritize outreach, optimize campaigns, and understand customer behavior.

Available classification business cases:

DM Propensity - Likelihood that a customer responds to direct mail.

TM Reachability - Probability that a customer can be reached via telemarketing.

TM Conversion - Likelihood that a telemarketing call results in a conversion to a monthly donor.

SMS Conversion - Probability that an SMS campaign leads to a desired action.

Email Open - Likelihood that a customer opens an email.

Email Click - Likelihood that a customer clicks on an email link.

Subscription Churn - Probability that a subscriber cancels their subscription.

Middle Donor - Likelihood that a donor falls into the middle-donor segment.

Active Donor - Probability that a donor remains active.

Subscription Acquisition - Likelihood that a customer becomes a subscriber.

### Regression (Value / Amount)

These models predict a numerical value rather than a probability. They are used to estimate expected revenue, donation amounts, or customer lifetime value.

Available regression business cases:

DM Expected Amount - Expected donation amount from direct mail.

TM Expected Amount - Expected revenue from telemarketing.

SMS Expected Amount - Expected revenue from SMS campaigns.

Lifetime Value - Estimated long-term value of a customer.

## Response

Audience

Classification (Propensity / Probability)

DM Propensity

TM Reachability

TM Conversion

SMS Conversion

Email Open

Email Click

Subscription churn

Middle donor

Active donor

Subscription Acquisition

Regression (Value / Amount)

DM Expected Amount

TM Expected Amount

SMS Expected Amount

Lifetime value

<div class="grid grid-cols-2 gap-4">
  <div class="bg-blue-200 p-4 rounded">
    <h3 class="font-semibold mb-2">Classification — Response</h3>
    DM Propensity<br />
    TM Reachability<br />
    TM Conversion<br />
    SMS Conversion<br />
    Email Open<br />
    Email Click
  </div>

  <div class="bg-pink-200 p-4 rounded">
    <h3 class="font-semibold mb-2">Classification — Audience</h3>
    Subscription churn<br />
    Middle donor<br />
    Active donor<br />
    Subscription Acquisition
  </div>

  <div class="bg-yellow-200 p-4 rounded">
    <h3 class="font-semibold mb-2">Regression — Response</h3>
    DM Expected Amount<br />
    TM Expected Amount<br />
    SMS Expected Amount
  </div>

  <div class="bg-green-200 p-4 rounded">
    <h3 class="font-semibold mb-2">Regression — Audience</h3>
    Lifetime value
  </div>
</div>

## Selecting a Business Case on the Home Page
<Tabs>
  <Tab title="Home models">
    <img src="https://mintcdn.com/allyyio/d21SlkeVIppKcXBo/images/dashboards_evaluation/home_models.png?fit=max&auto=format&n=d21SlkeVIppKcXBo&q=85&s=97f04aba6b19a352d13bae1c87517b1d" alt="Home models" width="929" height="457" data-path="images/dashboards_evaluation/home_models.png" />
  </Tab>
</Tabs>

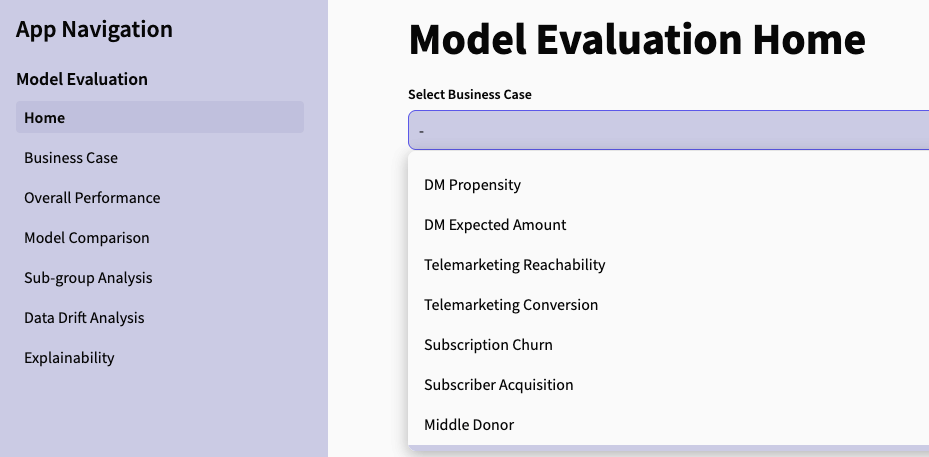
The Model Evaluation Home page includes a dropdown menu labeled Select Business Case. This is the first step in the evaluation workflow.

### How it works

The user selects one of the available business cases from the dropdown.

Once selected, the platform loads the relevant dashboards and metrics.

All navigation items (Overall Performance, Model Comparison, Sub-group Analysis, etc.) will now display results for the chosen business case.

### Why this step matters

Each business case has its own:

* KPIs
* evaluation logic
* performance metrics
* visualizations
* explainability outputs

Selecting the correct business case ensures that the dashboards reflect the right model and the right business objective.

## Business Case

The Business Case page provides an overview of how the selected model performs on unseen historical data (the holdout set). This allows users to understand how well the model would have performed in past campaigns, giving a realistic indication of its precision, targeting quality, and financial impact before applying it in real operations.

All results shown in this section are based on:

the business case selected on the Home page

the holdout dataset (past data not used for training)

the campaigns selected in the controls

the cost assumptions defined by the user

The left-side navigation remains fixed, but the content inside the Business Case page updates dynamically based on these selections.

## Controls in the Business Case Page

These controls shape the financial and operational assumptions used across all dashboards.

### Cost per Letter

Users enter the cost of sending one letter for the selected business case. This value affects:

total campaign cost

net revenue

ROI

profit curve

optimized vs. as-is comparison

### Select Campaigns (EntityID)

Users choose which campaigns to include in the evaluation. All dashboards update to reflect only the selected campaigns.

### Optimization Mode

Users can switch between:

As-is – current targeting strategy

Optimized – model-recommended targeting threshold

The optimized scenario adjusts:

letters sent

donors captured

income and cost

ROI

The comparison table shows the difference between the two scenarios.
