Overview:
- Monitoring Dashboard
- Logs
Monitoring Dashboard
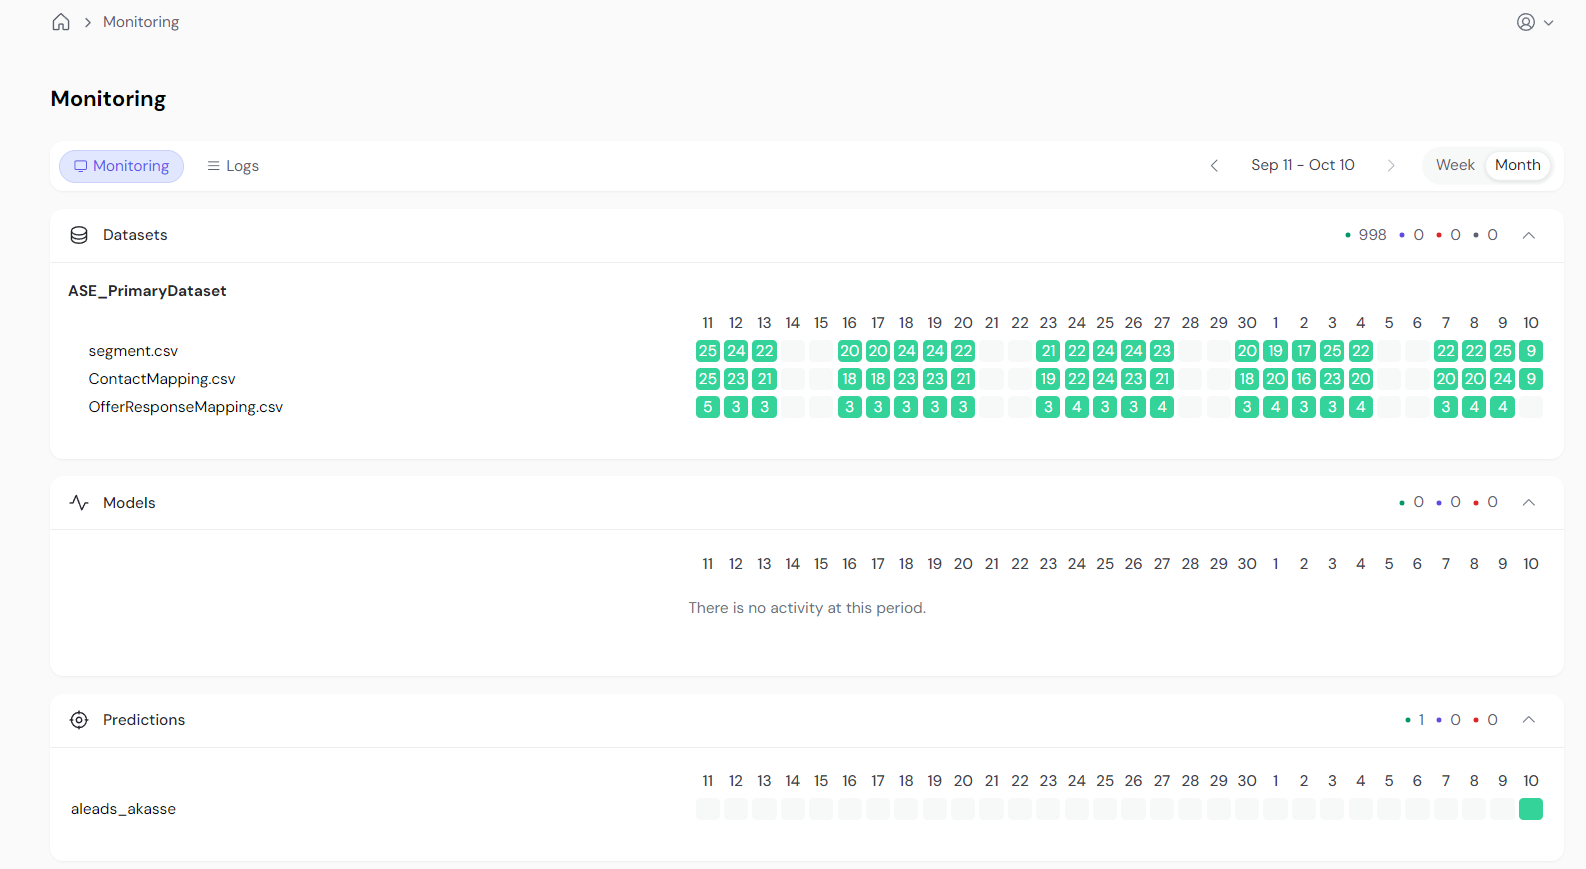
The Monitoring Dashboard displays processes executed over a timeline, allowing users to see when each process took place and its outcome. This is your central hub for tracking system operations.Key Features:- Processes Tracked: Datasets uploaded, models trained, predictions generated, exports synchronized, and workflows triggered are displayed by category.
- Time Horizon: A timeline that shows process executions. You can adjust the date selector to view historical data and toggle between monthly and weekly views.
- Color-Coded Status:
- Green: Process completed successfully.
- Blue: Process is in progress.
- Red: Process failed (click for more details).
- No Block: No processes ran that day.
- Multiple Executions: If a process was executed multiple times in a day, a number shows the count. Hovering over the number shows details of each run, with the latest result on the right.
- Click for Details: Clicking on any block redirects you to the specific history page filtered for that execution.
Conclusion:
The Monitoring Dashboard and Logs are essential tools for tracking system operations, providing users with both a historical overview and real-time updates of all processes within the platform.- Monitoring Dashboard: This tool allows you to visually track when processes have run and their outcomes over time. The color-coded status indicators give a quick health check of operations. Whether you’re troubleshooting a failed process or ensuring workflows are triggered successfully, the dashboard provides immediate insights. Additionally, you can drill down into process histories for detailed transparency and debugging.
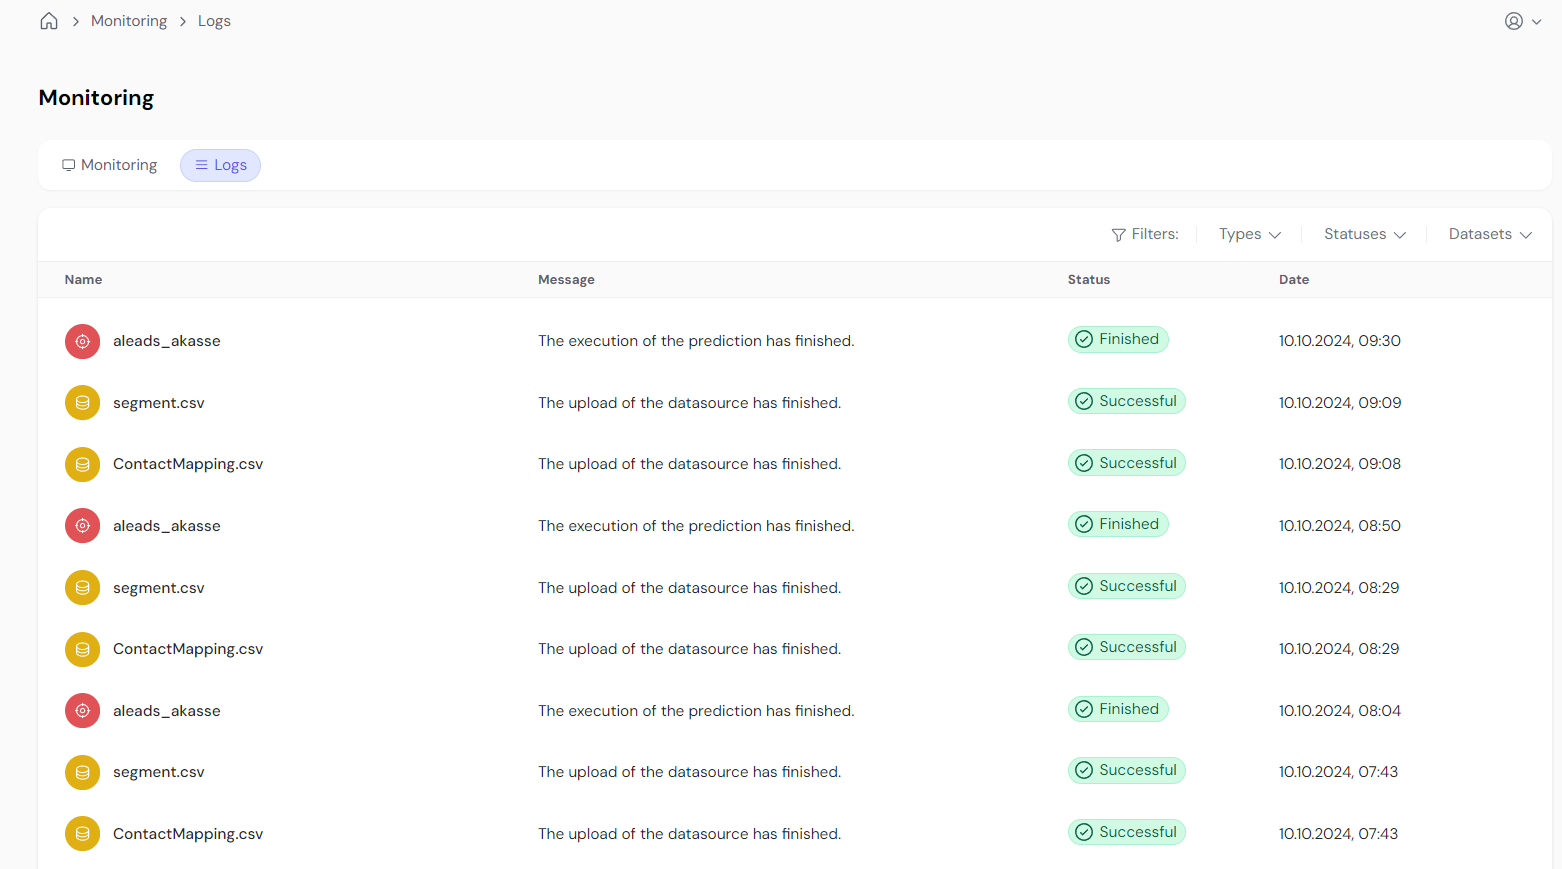
- Logs: While the Monitoring Dashboard offers a high-level view, the Logs page gives a real-time stream of events happening in the system. This allows for instant feedback on current operations and is especially useful for monitoring in-progress tasks or investigating issues as they arise.